Other Projects
Usability Evaluation - Facebook
Feature 1
I worked in team of four to conduct usability analysis on Facebook - a social networking website.
Data Collection
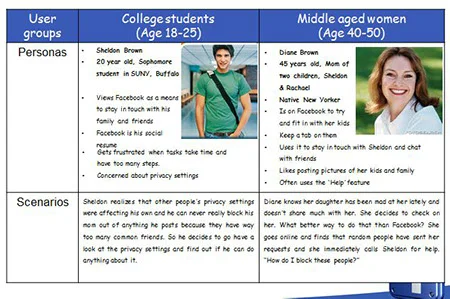
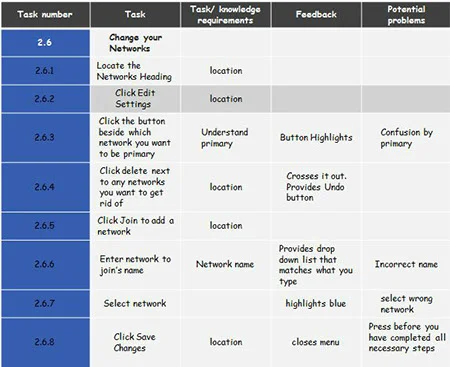
We started off by identifying and selecting our user groups - college students (18-25 yrs) and middle aged women (40-50 yrs). Then, we created personas and scenarios to get a better understanding of our users and identify the primary tasks that they might perform. We then conducted task analysis on two important and popular tasks -'Changing account settings' and 'Customizing the audience for photos'.
Usability Inspection
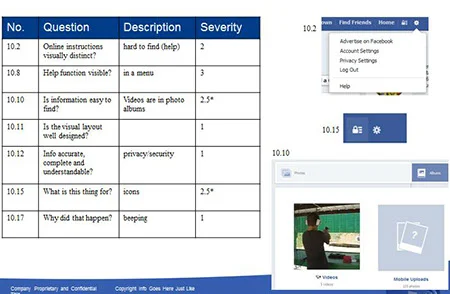
In our next step we decided to further analyze the system by conducting Heuristic Evaluation and Cognitive Walkthrough. Heuristic Evaluation was conducted using Deniese Pierotti's checklist. These issues were also analyzed for severity on a 1-3 (L-M-H) scale.
Usability Testing
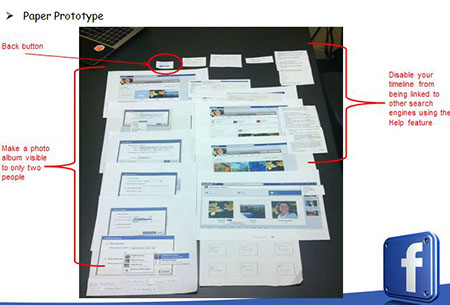
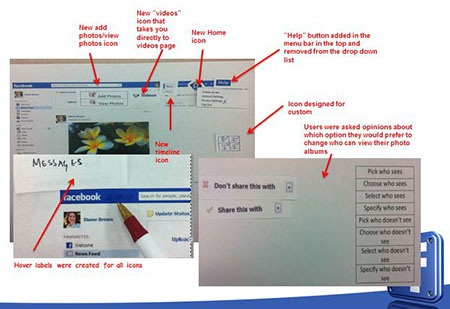
We then conducted 'agile field testing' with people representing the selected user group using low fidelity prototypes. Our initial round of testing was on the existing system. We followed it with two more iterations which entailed changes or modifications that the team suggested based on user tests results.
Final Results
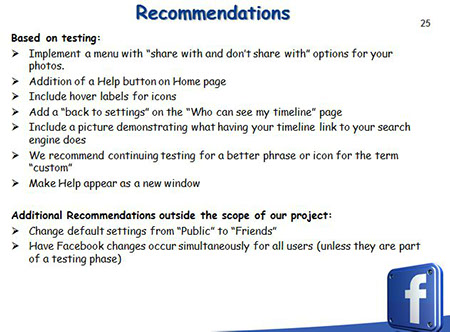
Various recommendations were made and tests showed considerable improvement in usability - 74 to 88. Our important metrics were: time taken to complete a specific task, discoverability and understandability of icons and terms, and user frustration.
OnTile
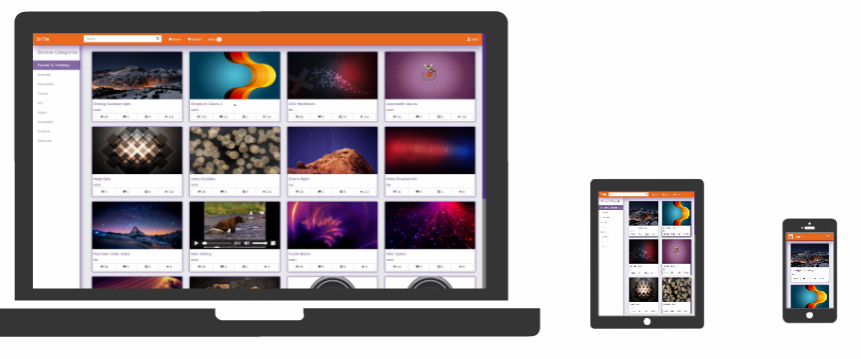
I worked in a team of two to develop a multimedia database system that allowed users to view, upload and share varied media files (Pictures, Videos, Presentation, etc.)
RITE and JTBD methods were used to test and evaluate the system.
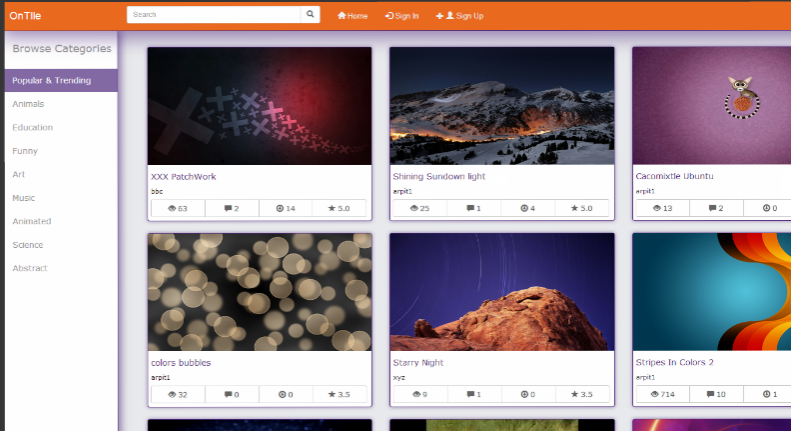
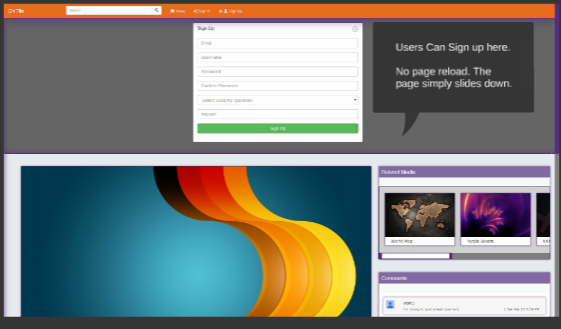
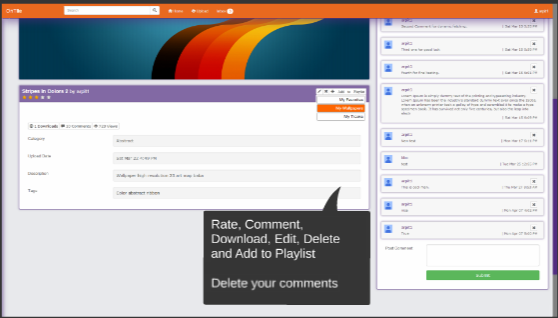
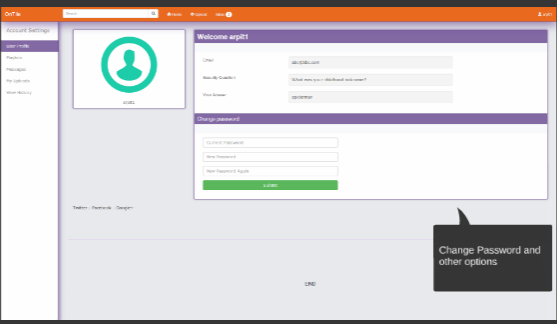
BGSA Website
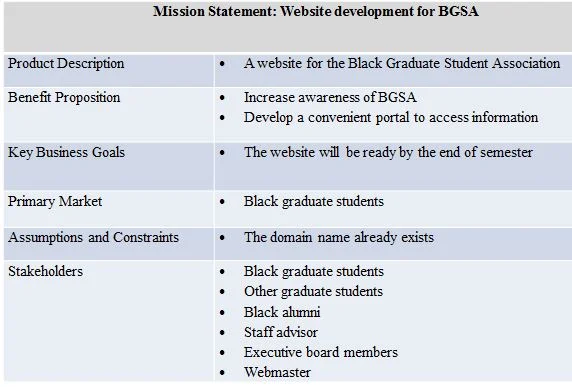
Developing a website for the Black Graduate Student Association at Clemson University was part of the course 'Design of Human Computer System'.
Identifying Customer Needs
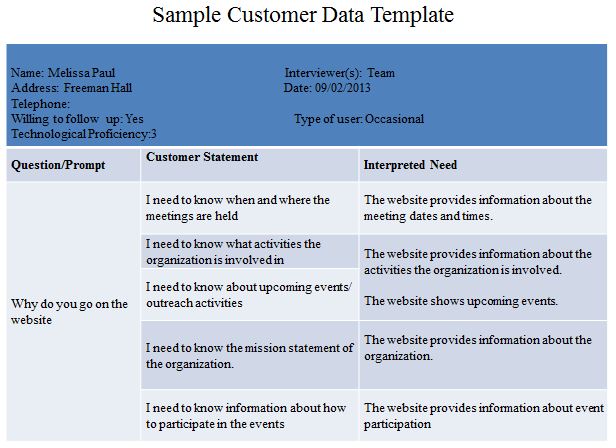
We started the design process by identifying and interviewing stakeholders of BGSA. A semi structure interview format was adopted and the data collected was translated to customer needs and requirements. Affinity diagramming was used to group and classify needs into specific categories. We, then, conducted a survey to sort needs based on importance.
Quantifying Needs
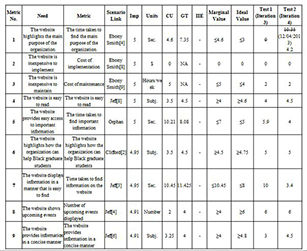
In the second phase of the project, we established quantifiable metrics, then set marginal and ideal target values. The goal of metrics was to help measure progress of the project.
Designing Mock-Up Layouts
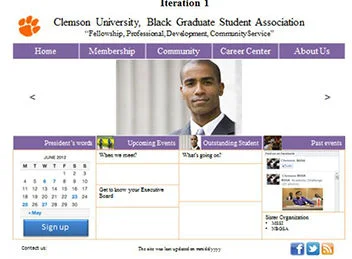
We brainstormed and created website layouts based on the requirements and specifications. We used Axure to build mock-ups and wireframes. Here, we also used card sorting to decide the menu structure.
Testing And Implementation
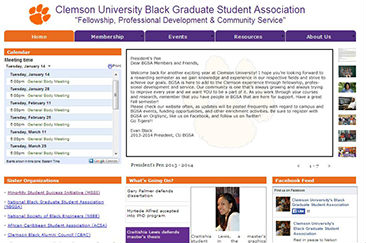
In the last phase we started designing the website using Adobe Muse. We conducted four iterations, continuously tested them with users and redesigned the website to incorporate the changes based on our testing. With every iteration, we updated the metrics sheet to track changes.
Our implementation of the website continues to be used by the organization.